Power Platform Analytics for Microsoft Dynamics 365 CE Part 1 – Capacity
With recent power platform releases, Microsoft introduced a great combination of analytics. This is really helpful in analyzing current CE instances and to make informed decisions.
These analytics are crucial in order to maintain a CE instance with optimum performance. Also, it helps all relevant stakeholders to make critical decisions.
Let’s see how to navigate to the “Power Platform Admin Center”.
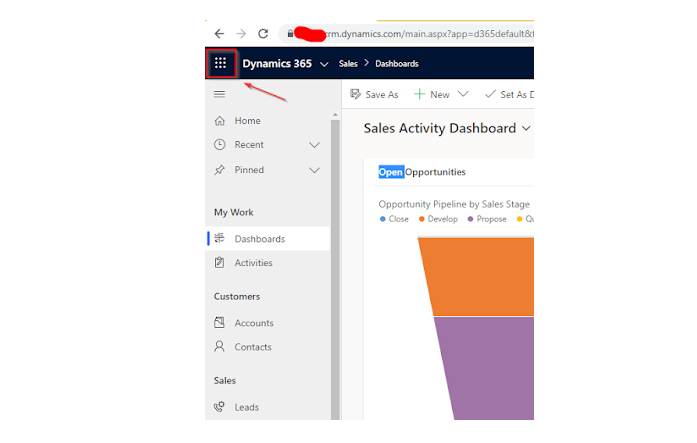
Then click on the admin link.
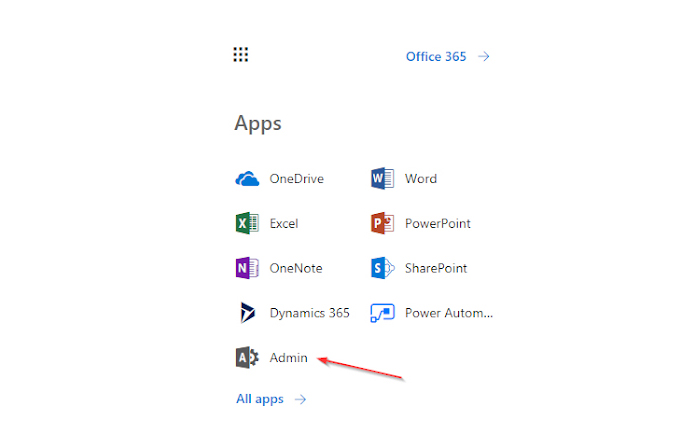
Under Admin centers, navigate to All Admin Centers and then click on Dynamics 365.

Expand the Analytics tab in the left pane.
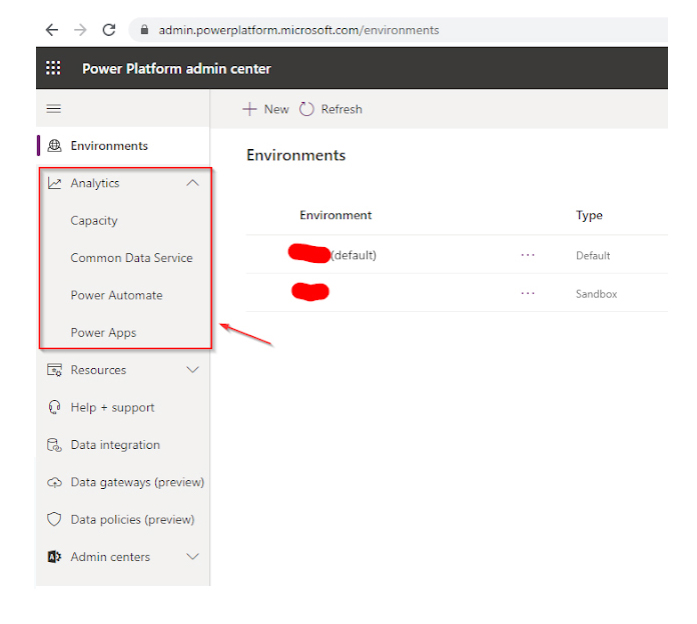
Note: You should have relevant D365 roles in order to open the D365 admin page.
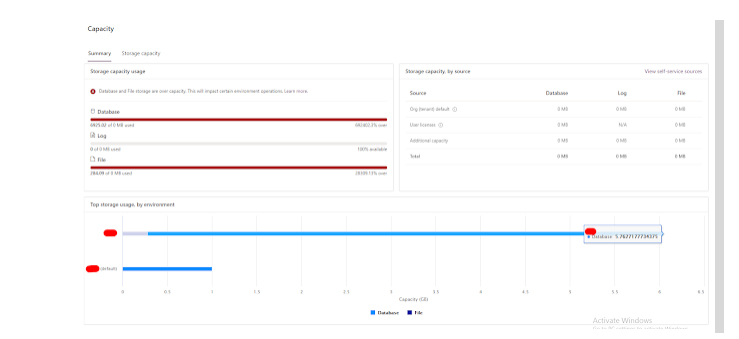
Capacity:
The capacity section will demonstrate database usage analytics. It will show you how much disk space you’ve already used up, how much disk space remains, and additional details like how much disk space is being used for database, logs and files. It will also list down all the environments in which you are a tenant. If you hover over the bar chart at the bottom of the page, you will see the exact storage usage for each category (file/database).
Note: For the purpose of this blog, I’ve used a trial environment, therefore it shows that the database has been exceeded. However, if you use a trial organization database, the space will not count.
Alternatively, you can use the Storage Capacity tab to view these capacity data by category.
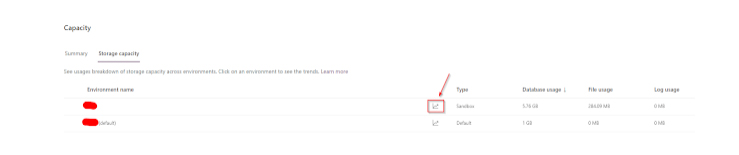
If you click on the chart icon corresponding to your CE environment name, it will provide you with a more detailed analysis on your environment as illustrated below.
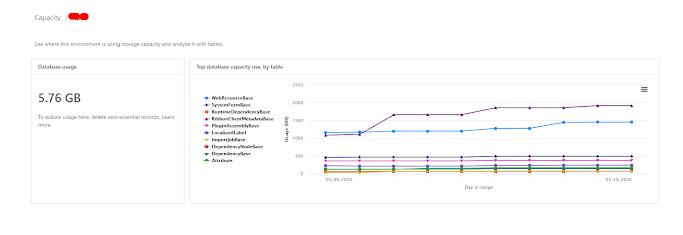
Note: You can export all these graphs and data by clicking on the menu icon at the top right corner.
The first chart will show top database usages based on category. A user can delete unnecessary files/data based on these figures.
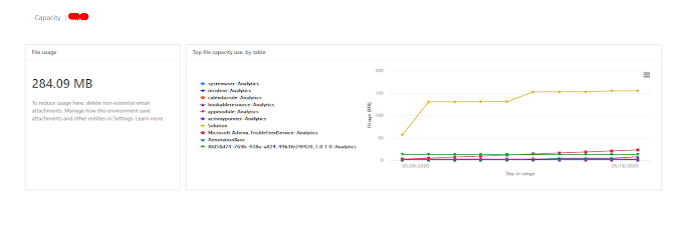
In addition, by utilising the following chart, a user can get an idea about file storage and how it is utilised. Based on this, administrators can decide whether to remove unwanted annotations or solutions or any other unnecessary artifact to reduce file storage.
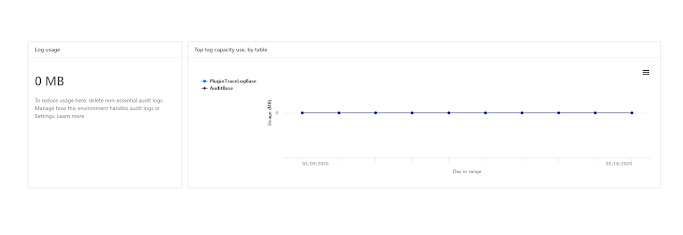
The last graph will show you how space is utilised for logs (plugin trace logs).

Gihan Lakmal
Tech LeadDeveloping a Custom Audit Trail and a Notification Service for a Workflow Based Serverless Application on AWS
READ ARTICLE
Human Emotions Recognition through Facial Expressions and Sentiment Analysis for Emotionally Aware Deep Learning Models
READ ARTICLE