Creating EC2 Custom Metrics via CloudWatch Monitoring Scripts
EC2 Monitoring with CloudWatch
We all know EC2 Monitoring can be done in two levels in AWS.
- Using AWS Provided Metrics (Basic and Detailed Monitoring)
- Using Custom Metrics (CloudWatch Agents and CloudWatch Monitoring Scripts)
Of these two, AWS provided metrics will give us information related to CPU Utilization, CPU Credit Balance, Network IN/ OUT and Status Checks (Instance Status and System Status). Whereas, Custom Metrics is primarily there to extract RAM details, Instance Swap details or any other custom metric.
EC2 Monitoring via Custom Metrics
The second level of EC2 Monitoring mentioned above, i.e. using Custom Metrics, is twofold in AWS.
- Custom Metrics via CloudWatch Agents (the recommended way)
- Custom Metrics via CloudWatch Monitoring Scripts
EC2 Monitoring via CloudWatch Monitoring Scripts
In this blog post, we explain only the second option above, which is Custom Metrics via CloudWatch Monitoring Scripts for EC2 instances.
Steps
Step 1: Create an Amazon Linux EC2 instance that you need to monitor.
Step 2: SSH into the EC2 instance and set the environment in order to execute EC2 CloudWatch Custom Scripts.
$ sudo yum update
$ sudo yum install -y perl-Switch perl-DateTime perl-Sys-Syslog perl-LWP-Protocol-https perl-Digest-SHA.x86_64
Step 3: Now download, install and configure monitoring scripts to a preferred folder in the EC2 instance.
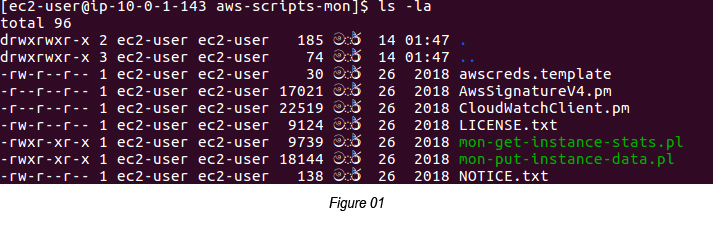
Step 4: Unzip the downloaded Zip file and move it to the aws-scripts-mon folder
$ unzip CloudWatchMonitoringScripts-1.2.2.zip
$ cd aws-scripts-mon
You should see the following scripts in the aws-scripts-mon folder now (see Figure 01).
Step 5: Create an IAM Role to push the CloudWatch metrics from EC2 (you need to execute this step in AWS IAM).
You can use CloudWatchFullAccess AWS policy to create this role. After creating the IAM Role, you can attach the role to the EC2 instance.
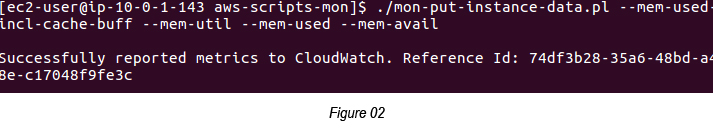
Step 6: Go back to the EC2 instance where you intend to execute the Custom scripts and execute the following script (mon-put-instance-data.pl) to push it to CloudWatch (see Figure 02).
Step 7: If you wish, you can even schedule this CloudWatch metrics pushing job to every 5 minutes via crontab.
$ crontab -e
*/5 * * * * ~/aws-scripts-mon/mon-put-instance-data.pl — mem-used-incl-cache-buff — mem-util — disk-space-util — disk-path=/ — from-cron
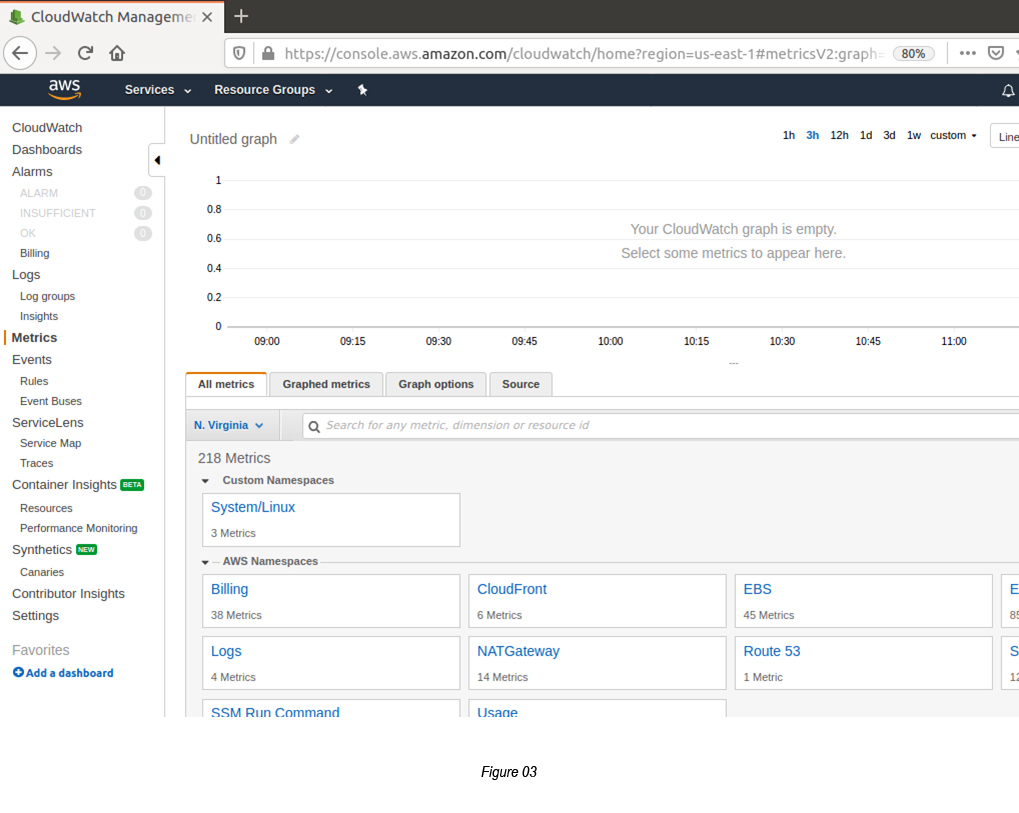
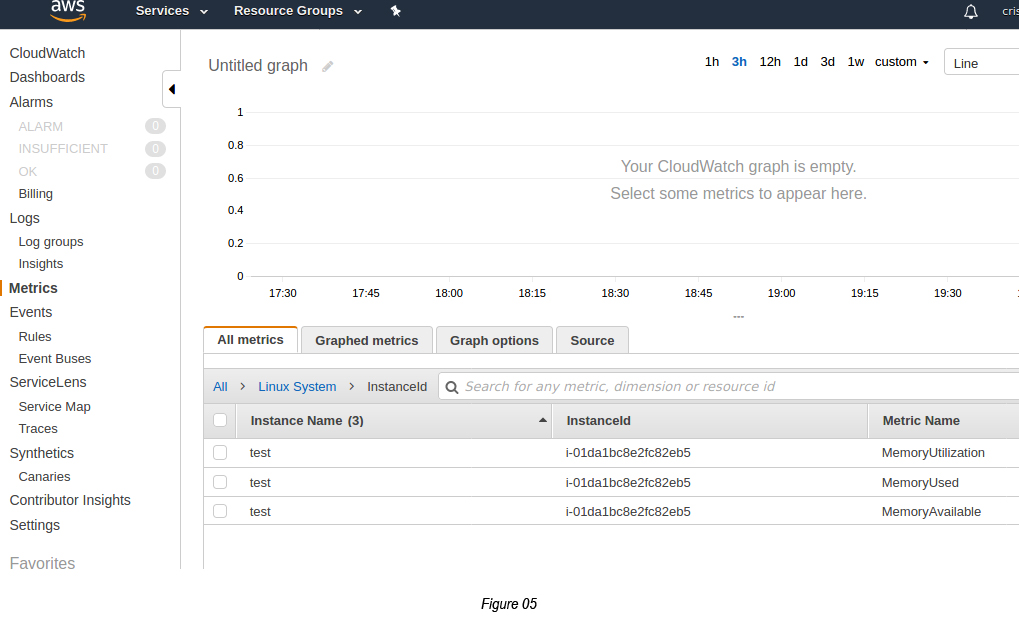
Step 8: You can now go to CloudWatch in the AWS Console to see the Memory related metrics populated by CloudWatch Custom Metrics Scripts.
Go to CloudWatch → Metrics → Select “All Metrics” → Select “Custom Namespaces” → Select “System/ Linux” → Select “Instance Id”
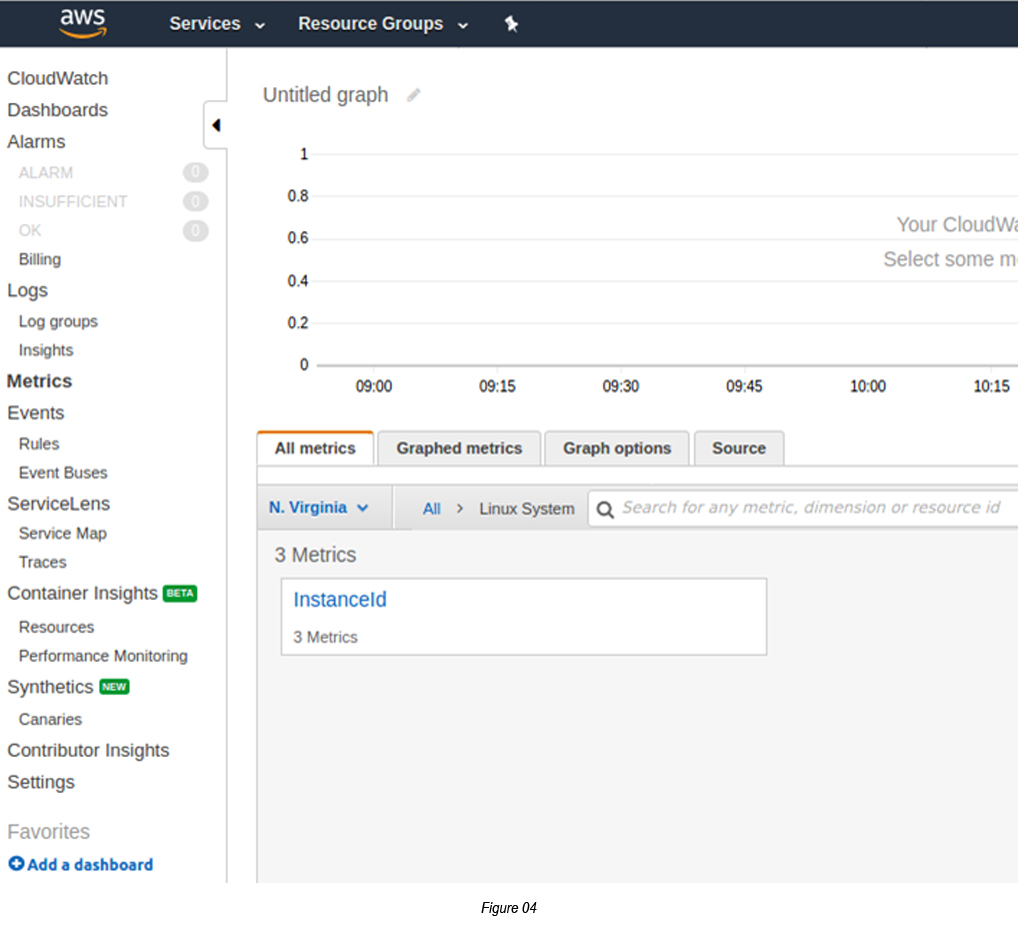
You will see three EC2 instance metrics shown on it.
Finally, you can create CloudWatch Alarms out of these metrics. Well Done!
References:
- Monitoring Memory and Disk Metrics for Amazon EC2 Linux Instance: https://docs.aws.amazon.com/AWSEC2/latest/UserGuide/mon-scripts.html

Crishantha Nanayakkara
Vice President - TechnologyDeveloping a Custom Audit Trail and a Notification Service for a Workflow Based Serverless Application on AWS
READ ARTICLE
Human Emotions Recognition through Facial Expressions and Sentiment Analysis for Emotionally Aware Deep Learning Models
READ ARTICLE