US-Based Leading Modern Beverage Company - Case Study
NorthBay Solutions (northbaysolutions.com) is a premier AWS (Amazon Web Services) based advanced big data consulting partner based in the USA. Northbay Solutions initiated its offshore consulting in Lahore, Pakistan. 1 Billion Tech, formerly Auxenta, collaborated as their second offshore consulting partner in the space of AWS Big Data consultancy.
The Challenge
The challenge here was to create an AWS enabled data pipeline to ingest, store and make available for consumption via Tableau and also to leverage a lightweight ETL tool to facilitate any transformations. Another element of this challenge was to prove that the beverage company client could easily analyze the ‘time to delivery’ component for online orders delivered via FedEx by utilizing AWS services.
HOW 1 BILLION TECH HELPED
As an offshore consulting partner, 1 Billion Tech, has helped the client’s employees who have been working on this project in numerous possible ways to accomplish the objectives of the client. 1 Billion Tech has assisted the NorthBay Pakistan offshore team on multiple engagements previously, whereas this was a direct client task for the Sri Lankan offshore team.
We provided a data lake reference architecture as a solution for this problem and then went on to build the solution by utilizing AWS services such as Lambda functions, S3, Redshift, SQS and a third party tool called Matillion, in order to do transformations and data migration from AWS S3 to Redshift.
THE SOLUTION
The deliverable of this project can be divided into three major components such as:
- Data ingestion to AWS S3. Following are the four types of files which we had to ingest.
- SAP Hana - Files from the SAP Hana RDBMS
- FedEx - Files from the FedEx Delivery company stored on-prem
- State/Region - From the local RDBMS
- DeliveryDate - From the local RDBMS
- Loading the data via Matillion to Redshift and optimizing it. Matillion is the ETL tool which has been used in this use-case.
There will be four different orchestration jobs in order to copy data from S3 to AWS Redshift, with respect to each file type. Whereas Redshift will be holding four staging tables in order to store the data within the data warehouse. As soon as the information of every file comes through AWS SQS to Matillion, it will then process the file and trigger the appropriate orchestration job, which will then migrate the data from S3 to the relevant staging table. Similarly, all the four tables will be generated.
Once the staging tables have been generated for the day, the FedEx and SAP Delivery files will be joined on the tracking number in order to create a fact table in Redshift. As the beverage company client wanted us to include all the deliveries in FedEx files even if there was no corresponding SAP Delivery file record, a LEFT OUTER JOIN will be performed with the FedEx table being on the left side. The join will be performed on a scheduled basis, i.e it’s assumed that all the necessary files (4 FedEx files and the appropriate SAP Hana delivery file is loaded into Redshift) by the cut off time, given in the scheduler. Each day, the new delivery records for the day will be appended to the fact table from the previous day, so that the fact table will have all the delivery records since the first day it was generated.
The joining process was done as a transformation in Matillion, hence a transformation job was created to accomplish this. There were few transformations other than the join, which had to be done before inserting the filtered data into the fact table. These transformations include removing rows which contain null or empty values for a specific column and extracting only the first 16 digits of the transaction number. These were solely done based on our assumptions.
As a result, there are two types of processes in this section. One is the initial load and the other is the incremental load. Initial load is where the data gets loaded into the tables for the first time. Incremental load is where the data is ingested after a specific timestamp from the max of the previously inserted records. Therefore, we made sure that it only inserted the new set of records, and not the existing ones. As a backup plan, the data in the fact table was extracted and backed up in S3, on a daily basis as a parquet format.
- Report creation in Tableau. Tableau is the visualization and BI tool which has been used in this use-case.
Tableau gets the data from the Redshift tables in order to show the necessary KPIs and calculated fields within a certain time frame.
CONCEPTUAL ARCHITECTURE DIAGRAM
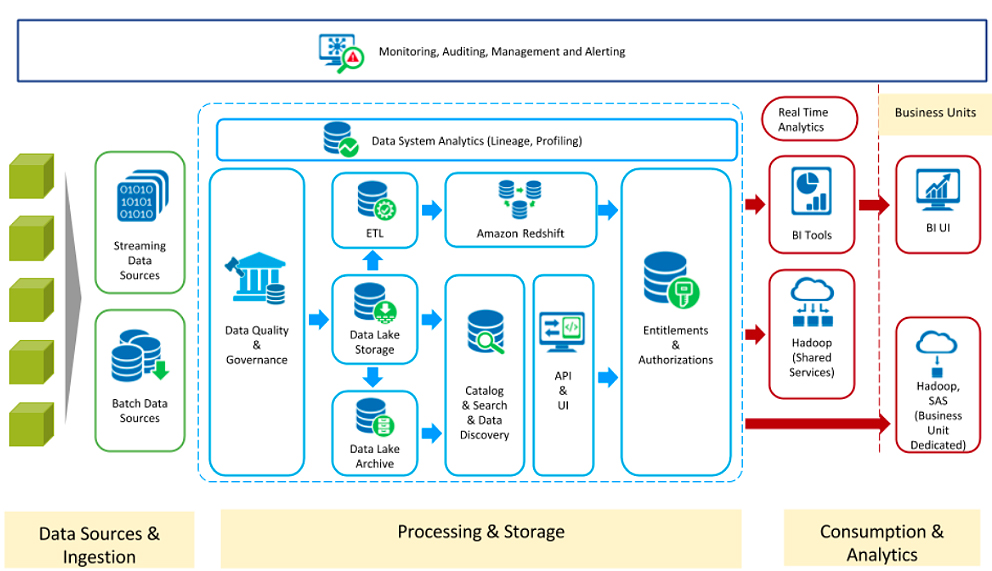
Before executing the Python scripts to load the input data source into S3, the lambda functions, which are used to generate the weekly folders within a fiscal year, should be executed manually so that the Python scripts can transfer the files into the correct week’s folder. The weekly folder creation of a fiscal year is only done for the FedEx and SAP delivery files.
These files are being stored in the client’s environment on a daily basis. In order to extract these source files, Python scripts were created and made to run/execute on-prem, so that the files are placed in the appropriate S3 bucket, i.e Fedex > 2017-2018 > week-01 > file.csv or Region > file.csv or SAP > 2018-2019 > week-02 > file.csv. These Python scripts or jobs will initially be executed manually, and later integrated with Control-M.
The appropriate AWS lambda function will be triggered whenever a file is placed in any of the S3 landing buckets of the four files. Four different lambda functions were created in order to handle these four types of files. An SQS queue also was created, in order to communicate between AWS and Matillion (ETL tool). Once the lambda is triggered, it will automatically grab the file name and other Matillion job related information, and thereafter send it to the SQS queue which we created. Matillion was configured to listen to the SQS queue.
Once SQS receives a message or a notification to its queue, with all the details, it will pass it on to Matillion, wherein it will start executing the appropriate orchestration job.
BENEFITS TO CLIENT
With the use of the above approach, the client was able to:
- Utilize an AWS enabled data pipeline to ingest, store and make available for consumption via Tableau
- Leverage a lightweight ETL tool such as Matillion to facilitate transformations
- Exploit the AWS Redshift data warehouse to store and extract data from and to S3
- Enable a dashboard/report via Tableau to provide KPI visualization to their customers
- Analyze “time to delivery” for online orders delivered via FedEx